
Content
Appendix: Coefficient of Variation (CV)
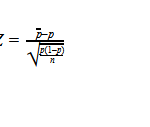
Z-score method
If data is distributed normally then we can use z-score method (or the three-sigma rule) to detect outliers (values exceeding 3 std deviations in both directions are considered as anomalies).
The following python snippet demonstrates how to detect anomalies in data:
import numpy as np# outliers exceed 3 std deviation in both directionsdata=[2,3,3,12,3,9,12,4,340,5,2,2,6,1,8,6,1,300,7,5,4,3,9]outliers=[]threshold=3 # three-sigma rule
m=np.mean(data)std=np.std(data)for val in data: z_score=(val-m)/std if np.abs(z_score)> threshold: outliers.append(val)print("data: ",data)print("outliers: ",outliers)data: [2, 3, 3, 12, 3, 9, 12, 4, 340, 5, 2, 2, 6, 1, 8, 6, 1, 300, 7, 5, 4, 3, 9]
outliers: [340, 300]
Tukey’s Method
If data is not distributed normally it’s common to use Tukey’s Method to detect outliers/anomalies. In Tukey’s method, we define a lower limit and upper limit.
Data within these limits, is considered ‘clean’ or normal. The lower and upper limits are determined in a robust way. That means, that the upper and lower limits do not get influenced by the presence of the outliers. This is a distinction from some other methods like the z-score method (described above), where the lower and upper limits are influenced by the outliers.In general, it is better to use robust methods.
The Upper and Lower limits are defined as follows:
Lower Limit = 25th Percentile — k*IQR
Upper Limit = 75th Percentile + k*IQR
where, k is generally 1.5 but must be adjusted if required. IQR is the Inter-Quartile Range (IQR = 75th Percentile — 25th Percentile of data) of the variable.
Example [ detection of anomalies with panda module, python ]:
import pandas as pddf=pd.read_csv(r'C:\Tool\StudentsPerformance.csv')Q1 = df['score'].quantile(0.25)Q3 = df['score'].quantile(0.75)df['outliers'] = df['score'].apply(lambda x: 'Outlier' if x > Q3+1.5*IQR or x<Q1-1.5*IQR else 'Normal')
The Outlier Ratio
Appendix: Coefficient of Variation (CV)
The Coefficient of Variation (CV), known also as the relative standard deviation, is a normalized measure of dispersion and computed as the ratio of the standard deviation (STD) to the mean:

The standard deviation (STD) shows the average distance between data points from the mean. The STD on one dataset and the STD on other dataset can significantly differ in magnitudes while the variability is similar. Therefore we need normalize the standard deviation to gauge variability as a dimensionless index.

23+ years’ programming and theoretical experience in the computer science fields such as video compression, media streaming and artificial intelligence (co-author of several papers and patents).
the author is looking for new job, my resume
Related posts:
 Software Testing and Statistics (simplified cases from real practice)
 Exercise in Combinatorics for Team Leader
 What’s the probability for two randomly selected integers to be relatively prime?
 Generator of True Random Numbers Based on Quantum Fluctuations of Vacuum
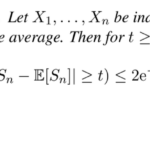 Hoeffding’s Inequality
 Classification Visual Artifacts in Video Coding Systems
Hello very cool web site!! Man .. Excellent .. Amazing .. I’ll bookmark your web site and take the feeds additionally…I am happy to seek out a lot of helpful information here within the post, we need work out more strategies on this regard, thank you for sharing. . . . . .
certainly like your web-site but you need to test the spelling on several of your posts. Several of them are rife with spelling problems and I to find it very bothersome to inform the truth on the other hand I will definitely come back again.
i have no money for hiring a skilled technical writer. This site is non-profitable to help people from poor countries to be familiar with modern technology. Professional courses are very expensive.
whoah this blog is magnificent i love studying your posts. Stay up the good paintings! You already know, a lot of persons are searching around for this information, you could help them greatly.
Merely a smiling visitor here to share the love (:, btw outstanding design.
you’re in reality a excellent webmaster. The website loading speed is incredible. It seems that you are doing any unique trick. Moreover, The contents are masterwork. you’ve done a magnificent activity on this matter!
Some really fantastic articles on this web site, appreciate it for contribution. “Be absolutely determined to enjoy what you do.” by Sarah Knowles Bolton.
Wow! This blog looks just like my old one! It’s on a totally different subject but it has pretty much the same page layout and design. Wonderful choice of colors!
I am extremely impressed with your writing skills as well as with the layout on your weblog. Is this a paid theme or did you modify it yourself? Either way keep up the excellent quality writing, it is rare to see a nice blog like this one nowadays..
I was reading some of your content on this website and I conceive this internet site is very instructive! Keep posting.
The next time I read a blog, I hope that it doesnt disappoint me as much as this one. I mean, I know it was my choice to read, but I actually thought youd have something interesting to say. All I hear is a bunch of whining about something that you could fix if you werent too busy looking for attention.